See where gamma is — and watch price move through it.
GammaEdge turns intraday SPY gamma snapshots into one focused trading cockpit: current gamma structure on the left, gamma migration through the session on the right, and the actual SPY path overlaid directly on both.
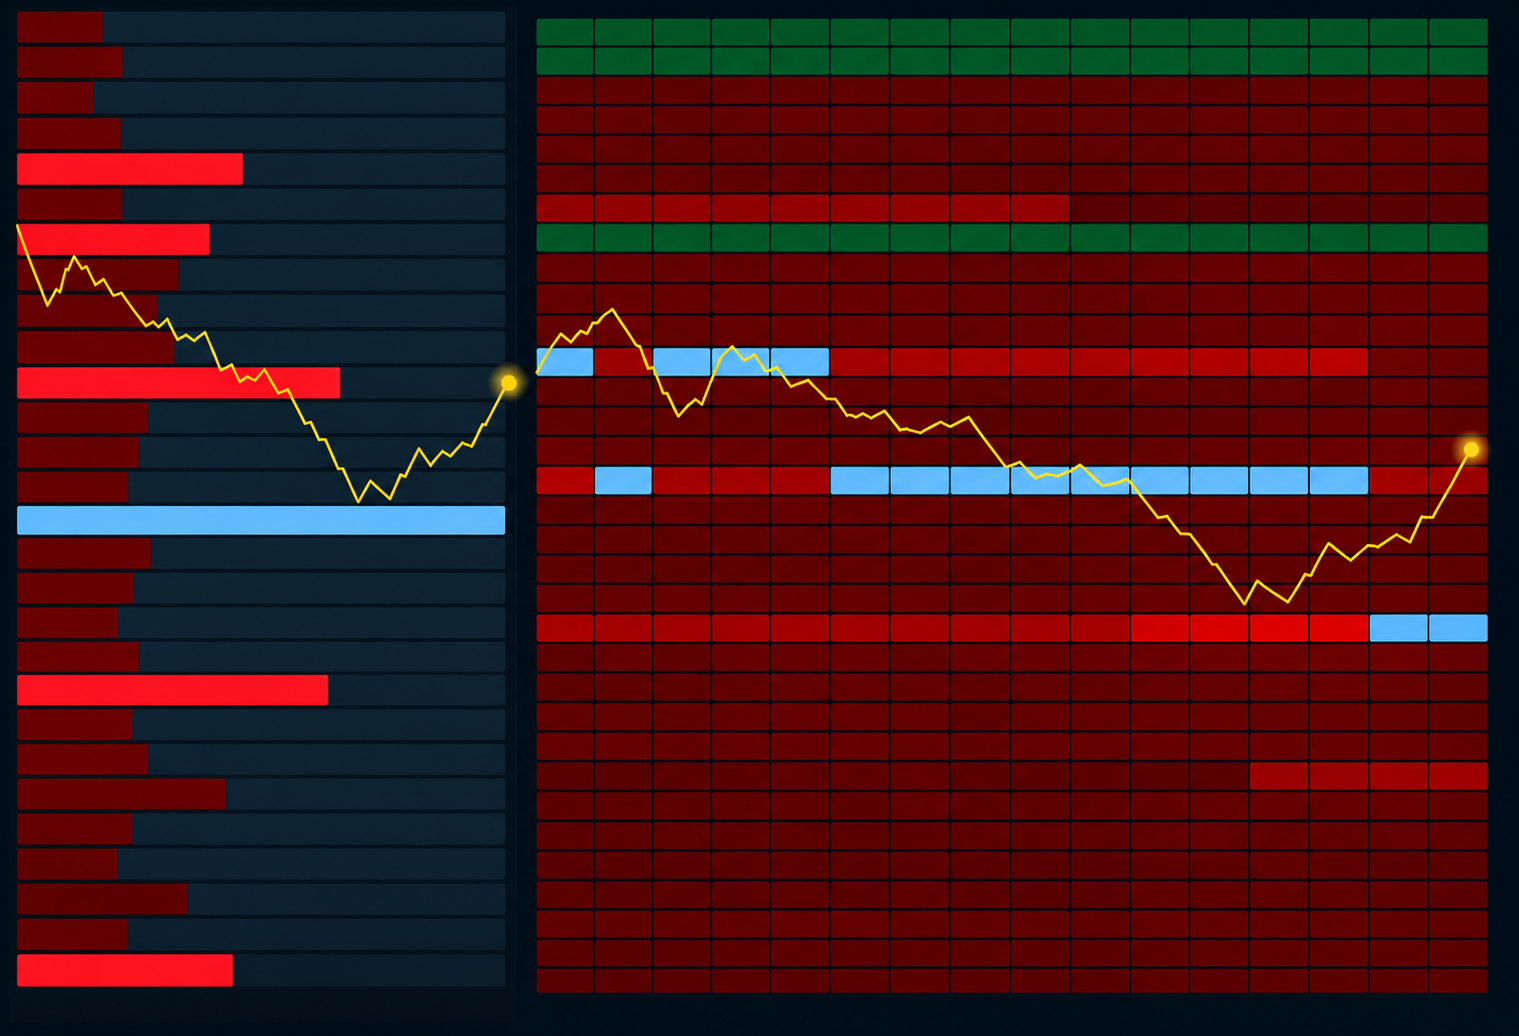
Built to show structure, movement, and interaction.
Instead of separating gamma and price into unrelated charts, GammaEdge places them in the same visual frame so you can see how the market structure changes while SPY moves through the session.
Where is gamma concentrated now?
The Gamma Wall keeps the session centered around SPY and makes the strongest positive and negative concentrations immediately visible.
Where is the dominant level moving?
Each timestamp is evaluated independently. The strongest absolute GEX level is highlighted in blue so migration across strikes is easy to follow.
How is SPY moving through it?
The yellow 5-minute SPY path sits directly over the gamma views, with a current-price beacon that makes the relationship visible without switching charts.
A focused SPY gamma cockpit.
See the current wall, watch gamma migrate, and follow SPY through the same structure — all from one session view designed to reduce chart switching and visual clutter.
Open Completed Session Demo